This site presents image example results of the patch-based denoising algorithm presented in:
C. Kervrann, J. Boulanger. Local adaptivity to variable smoothness for exemplar-based image denoising and representation. Int. J. Computer Vision, 2007. (accepted)C. Kervrann, J. Boulanger."Unsupervised patch-based image regularization and representation". In Proc. Eur. Conf. Computer Vision (ECCV'06) , Graz, Austria, May 2006.
C. Kervrann, J. Boulanger. "Local adaptivity to variable smoothness for exemplar-based image denoising and representation". INRIA Research Report, RR-5624 , July 2005.
Abstract
A novel adaptive and exemplar-based approach is proposed for image restoration and representation. The method is based on a pointwise selection of small image patches of fixed size in the variable neighborhood of each pixel. The main idea is to associate with each pixel the weighted sum of data points within an adaptive neighborhood. This method is general and can be applied under the assumption that the image is a locally and fairly stationary process. In this paper, we focus on the problem of the adaptive neighborhood selection in a manner that it balances the accuracy of approximation and the stochastic error, at each spatial position. Thus, the new proposed pointwise estimator automatically adapts to the degree of underlying smoothness which is unknown with minimal a priori assumptions on the function to be recovered. Finally, we propose a practical and simple algorithm with no hidden parameter for image denoising. The method is applied to both artificially corrupted and real images and the performance is very close, and in some cases even surpasses, to that of the already published denoising methods. Also, the method is demonstrated to be valuable for applications in fluorescence microscopy.Download full paper in pdf format
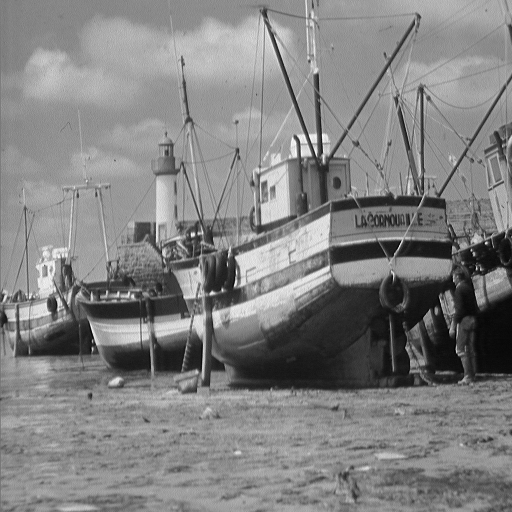
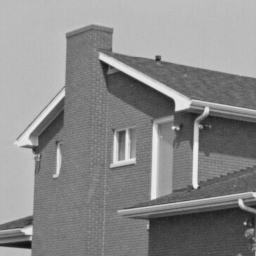
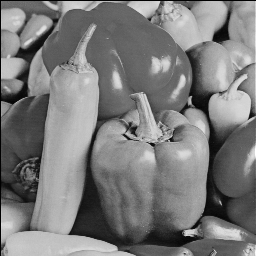
Denoising performance (standard deviation / PSNR value) on a commonly-used
set of test images
| sigma/PSNR |
(512 x 512)
|
(512 x 512)
|
(512 x 512)
|
(256 x 256)
|
(256 x 256)
|
5 / 34.15 dB |
37.91 dB |
37.12 dB |
36.14 dB |
37.62 dB |
37.34 dB |
10 / 28.13 dB |
35.18 dB |
33.79 dB |
33.09 dB |
35.26 dB |
37.04 dB |
15 / 24.61 dB |
33.70 dB |
31.80 dB |
31.44 dB |
34.08 dB |
32.13 dB |
20 / 22.11 dB |
|||||
25 / 20.17 dB |
31.73 dB |
29.24 dB |
29.20 dB |
32.22 dB |
29.73 dB |
50 / 14.15 dB |
28.38 dB |
24.09 dB |
25.93 dB |
28.67 dB |
25.29 dB |
75 / 10.63 dB |
25.51 dB |
22.10 dB |
23.69 dB |
25.49 dB |
22.31 dB |
100 / 8.13 dB |
23.32 dB |
20.64 dB |
21.78 dB |
23.08 dB |
20.51 dB |
All these results are obtained with 9 x 9 image patches.
Click on PSNR value for a comparison between noisy image (with given standard deviation) and denoising result.
Comparison with various methods are available in the report.
Some other results with simulated white Gaussian noise
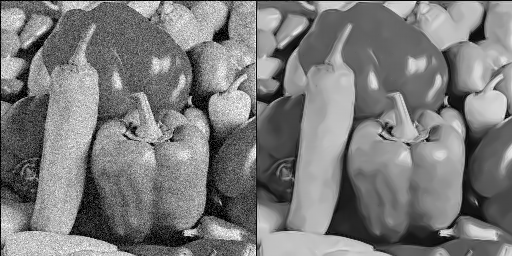
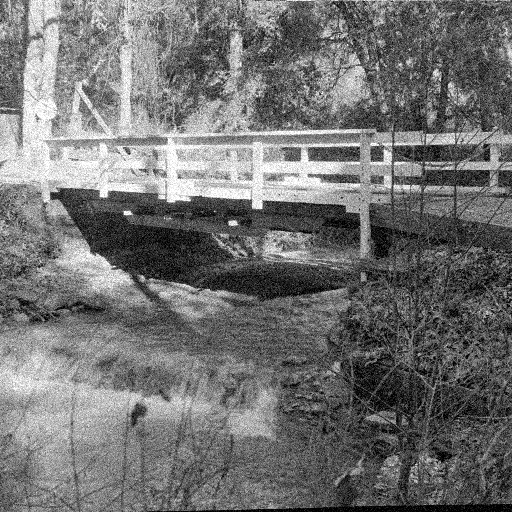
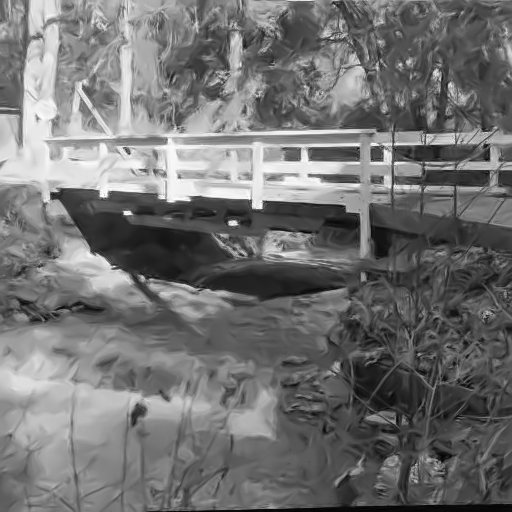
Noisy image (sigma = 30) |
Denoised image |
 |
 |
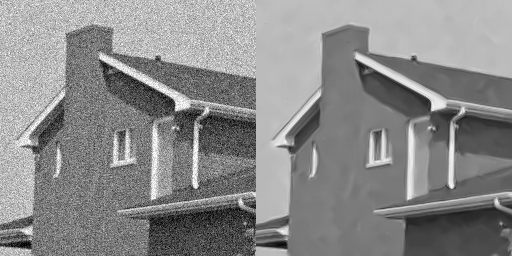
Noisy image (sigma = 20) |
Denoised image |
 |
 |
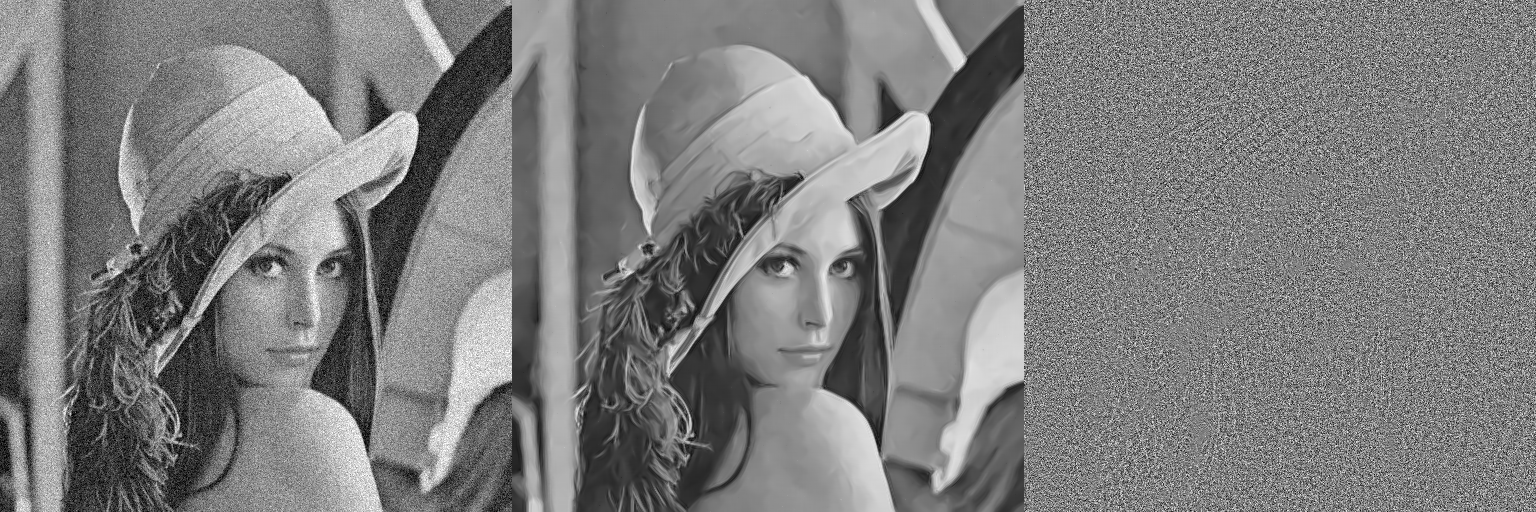
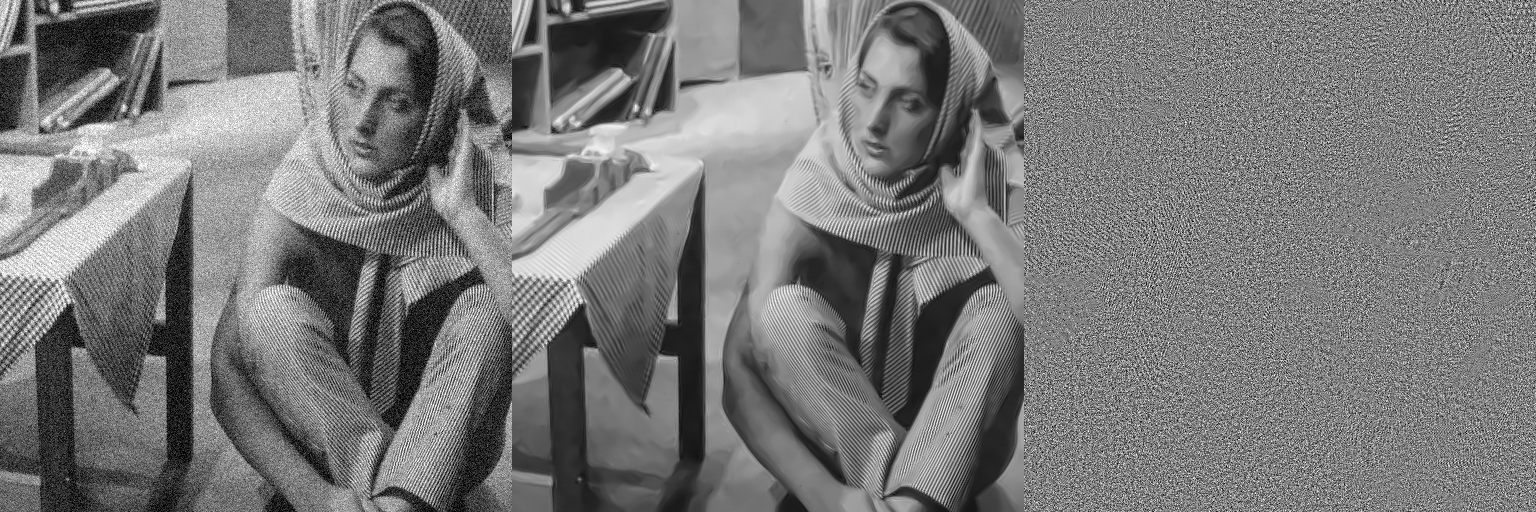
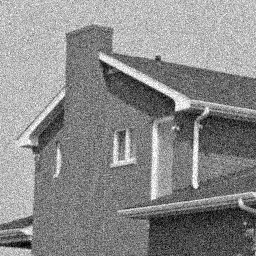
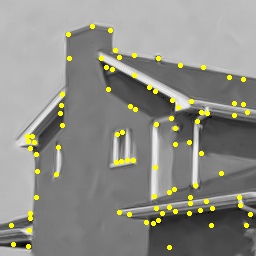
Noisy image (sigma = 20) |
Denoising and detection of exceptional patches |
 |
 |
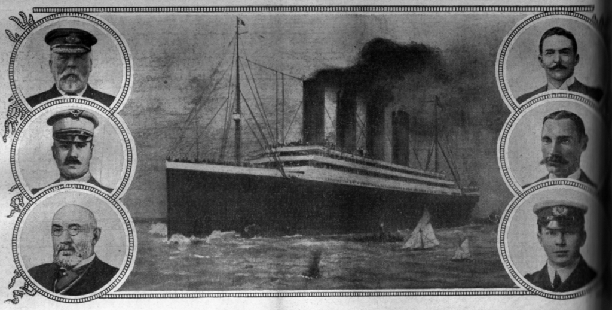
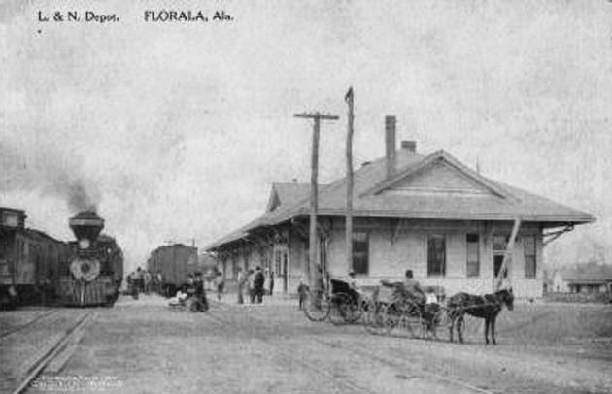
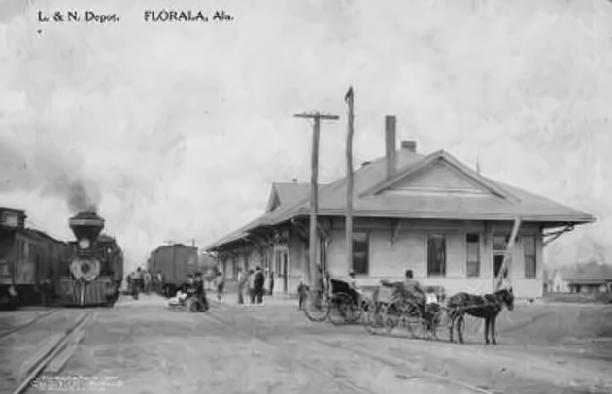
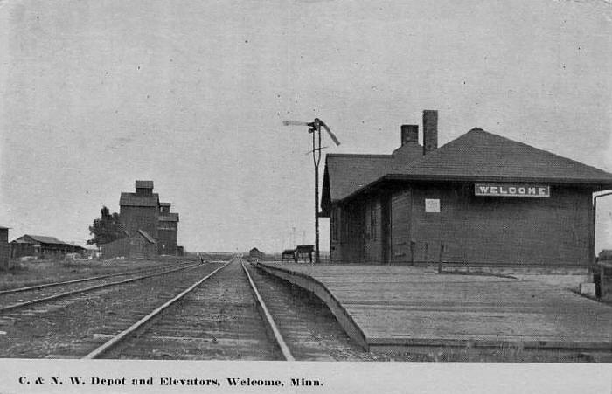
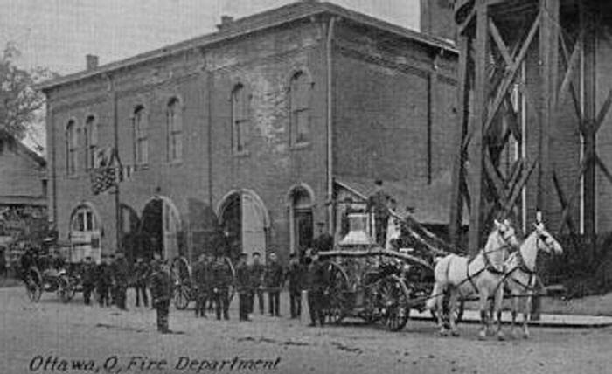
Typical old photographs
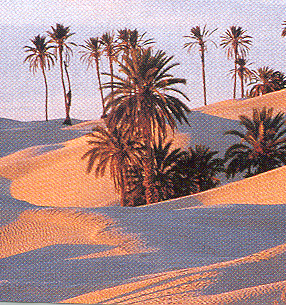
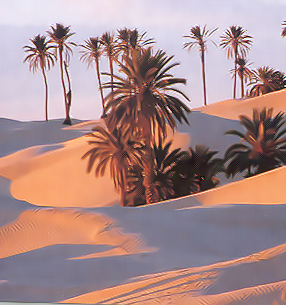
Real noisy image |
Restored image |
 |
 |
Real noisy image |
Restored image |
 |
 |
Real noisy image |
Restored image |
 |
 |
Real noisy image |
Restored image |
 |
 |
Denoising of noisy color images
Real image |
Denoised image |
 |
 |
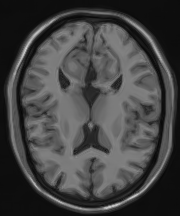
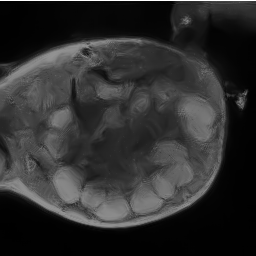
Denoising of MRI images
Real image |
Denoised image |
 |
 |
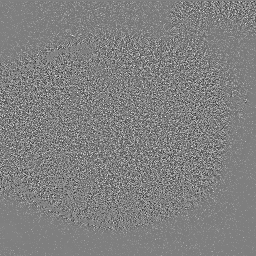
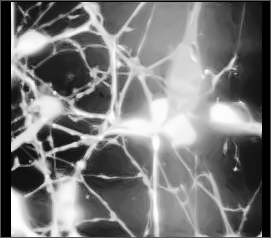
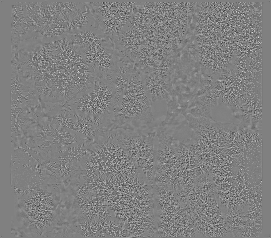
Denoising of confocal microscopy images in biology
Real image |
Denoised image |
Estimated noise component |
 |
 |
 |
Real image |
Denoised image |
Estimated noise component |
 |
 |
 |
Charles Kervrann Last modified: Tue Sep 20 12:28:12 CEST 2005