Parts of Meteosat images acquired on August 4 and 10, 1998.
 |  |
| Meteorological imagery Detection, tracking and characterization of convective cloud cells |
Contacts: P. Bouthemy, E. Mémin
| Demo overview |
The study of the life cycle of strong convective clouds is an important issue in the meteorological field. Indeed, such phenomena often cause hard weather situations as pouring rains or even tornadoes. We aim at providing nowcasters with new and efficient image processing tools. We have to address three distinct issues including a detection stage, a tracking stage of the cold cloud structures, which are potentially convective, and finally, a characterization stage of their convective activity. The tracking stage exploits the "Level Set" formalism. Curve contours are moved and deformed through an evolution equation applied to an associated implicit surface. The evolution function comprises two components acting successively. The first one exploits an estimated motion field and make each contour evolve in the direction of the dominant displacement starting from the location obtained in the previous image. Contour is then deformed by comparing the local temperatures with a predicted characteristic temperature of the cloud cell. Our tracking stage is able to make contours evolve in both directions, contraction and expansion, according to the local photometric context. The characterization of the convective activity is performed within each tracked regions. We have considered two relevant features to determine the atmospheric convection. The first one corresponds to the motion divergence and is derived from the estimated 2D motion field. The second one is the temporal variation of the local clouds temperatures. The study of the joined behavior of these two descriptors allows us to specify the tendency of the vertical movements associated with convective cells. The characterization results in segmenting areas delimited by each tracked contour in three classes, respectively denoted ``growing'' (upwards motion), ``declining'' (downwards motion), and ``non activity' ' or ``uncertainty' '. This issue is formulated as a contextual statistical labelling problem exploiting the Markov random fields. |
| Results |
| |
 |  |
| Algorithm implementation |
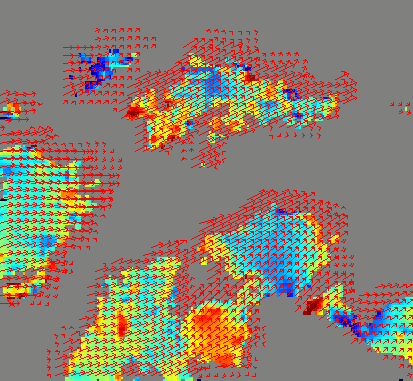 |
Superposition of the 2D estimated motion field (red arrows) on the divergence map computed at each poixel within regions resulting from the tracking stage. Colors of the divergence map vary from deep blue (strongly negative values) to the dark red (strong positive values). The motion is not estimated within the grey areas. Infrared Meteosat image from August 10, 1995 from 17h00 TU. |
|---|
 |  |  |
 |  |  |
It is possible to distinguish two phases of convective activity. The convective cloud cells first undergo a growing phase characterized by a spatial expansion and a drop in temperature of its top. After a phase of stability, the cells enter a declining phase corresponding to an increase of its temperature top and a dissipation of its structure. We consider two features to determine the convective activity: the motion divergence derived from a 2D estimated motion field and the change in temperature of the cloud top points.
| Applications |
|
This study aims at providing meteorological forecasters with an additional source of numerical information on the convective atmospheric phenomena. The tracking and the characterization of such cloud structures are particularly important since they may cause violent atmospheric phenomena such as strong rains, storms or hail. |
| Collaborations |
| References |
|
Webmaster : vista_webmaster@irisa.fr Last modified: Wed Sep 6 17:19:53 MET DST 2000 |
|
|