- Import the network in Cytoscape. File -> Import -> Network (multiple file types) and choose the network in SIF format (tf_sig_bnum_corrected.sif).
- Import the Gene Expression Data (matrix) file (.pvals) in Cytoscape : File -> Import -> Attribute/Expression Matrix and choose the file with .pvals extension (Stat_vs_Exp.pvals)
- Go to the Cytoscape menu and select: Plugins -> Bioquali
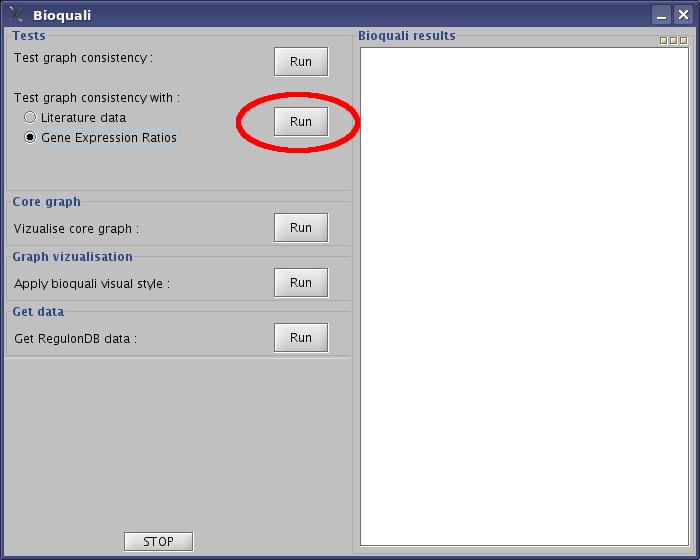
- Select "Gene Expression Ratios" option, and click the "Run" button.
 View image
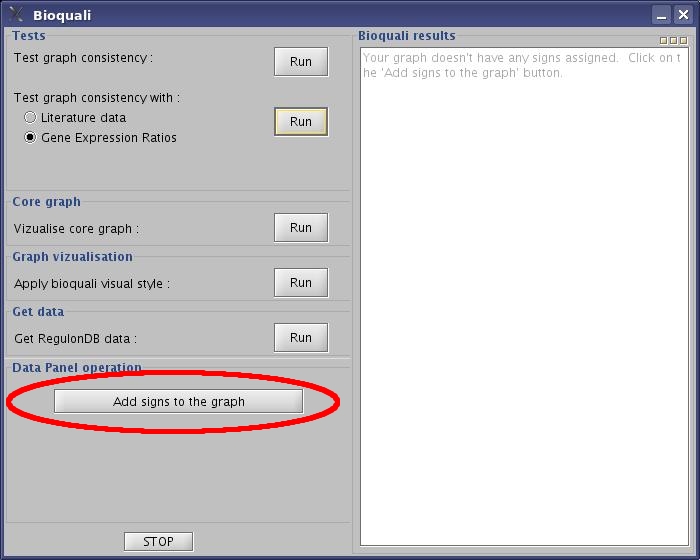
- Click the "Add signs to the graph" button to assign +,-,?,& values to your network.
 View image
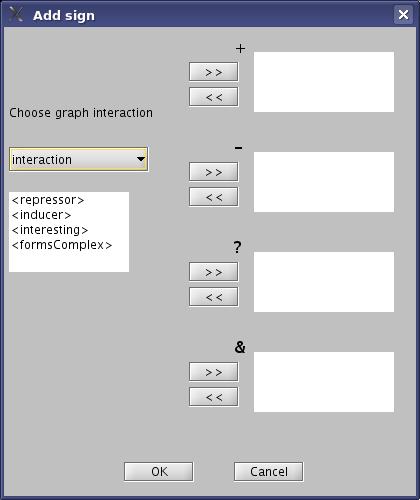
- Classify your Interaction labels into +,-,? or &, and then click "OK" button.
 View image
- Click the "Run" button next to the "Test graph consistency with" option.
View image
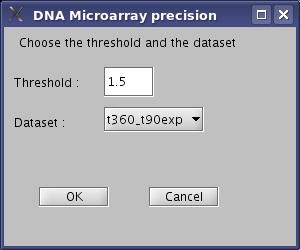
- Choose the threshold to filter your experimental data, and chose your experimental condition. In our example, put 1.5 in the threshold and choose t360_t90exp. Then click "OK" button.
 View image
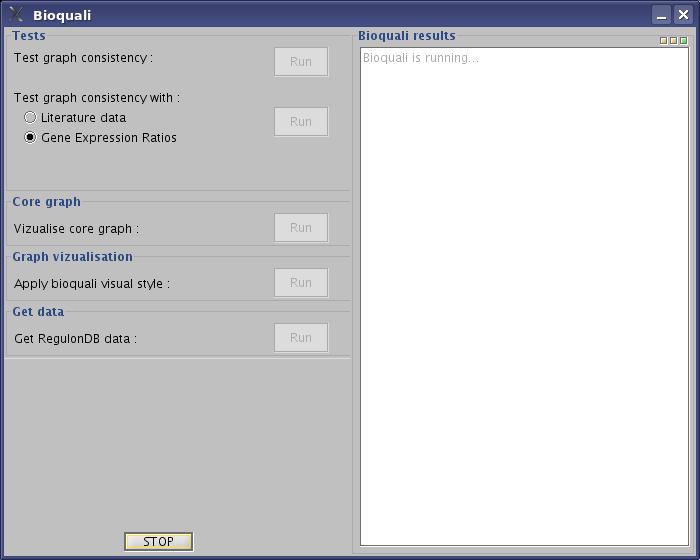
- Wait while bioquali is running...
 View image
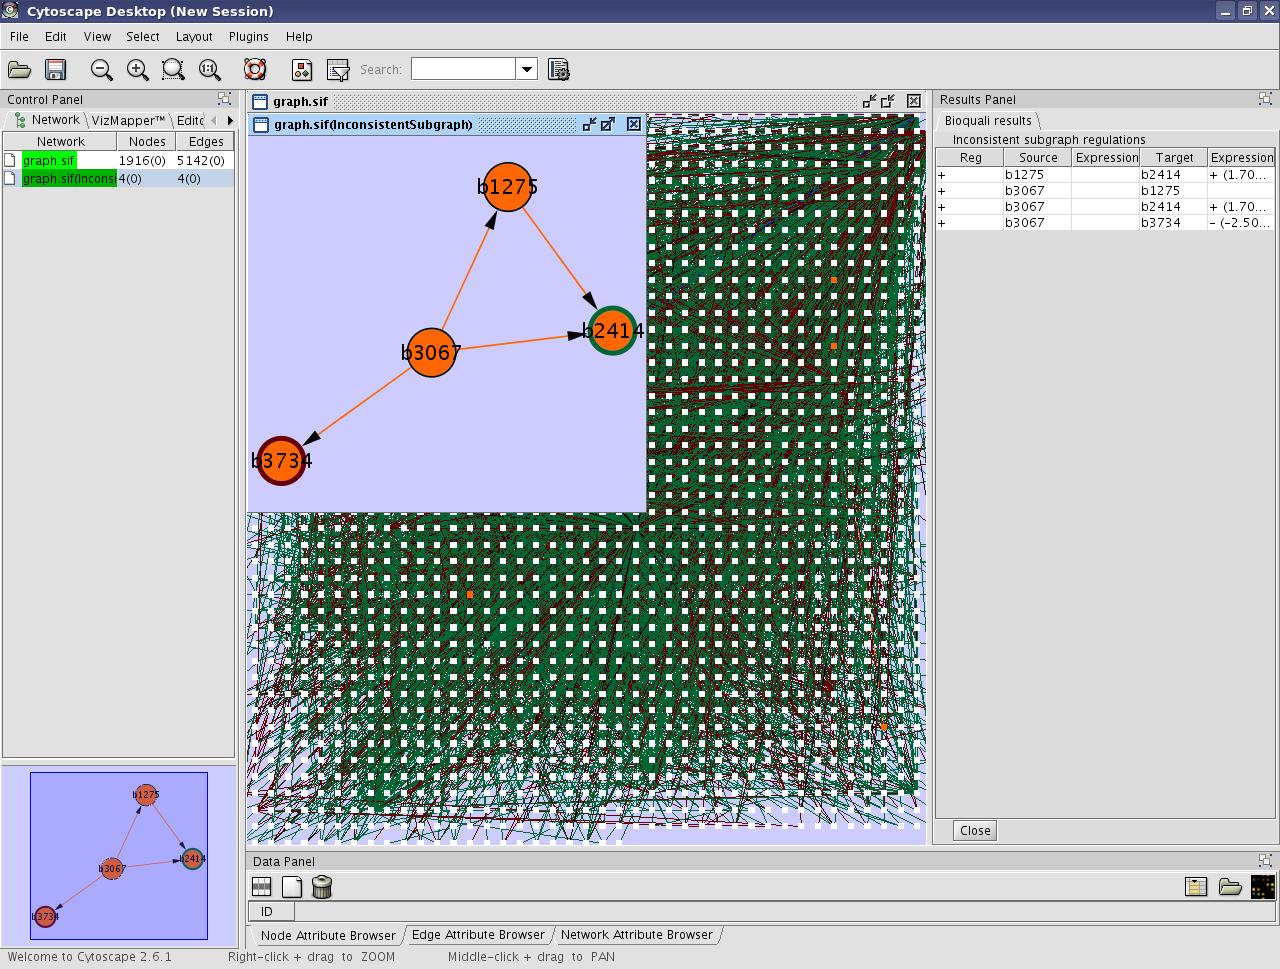
- Look the result on the cytoscape window :
 View image
You can see the inconsistent part of the network in orange on the original graph. A new graph will be built from this inconsistent region called inconsistent subgraph. The Results Panel in the right will list the inconsistent regulations.
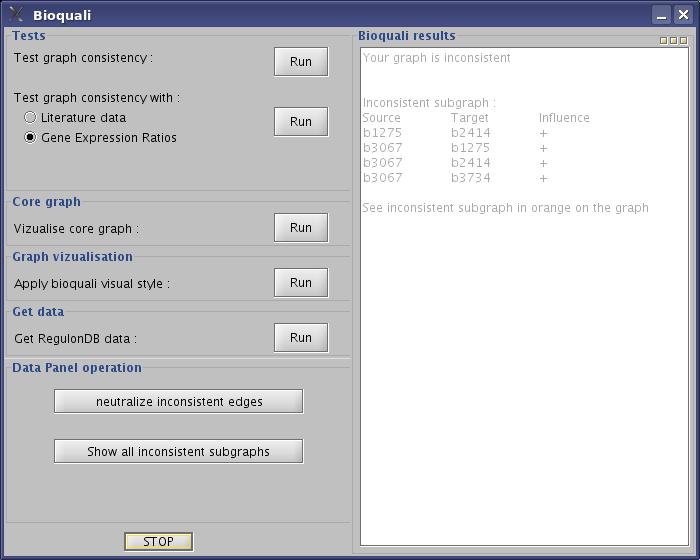
- Look the result on the bioquali window :
 View image
The Results part of Bioquali window will list the inconsistent regulations. The Data Panel Operation offers 2 actions : "neutralize inconsistent edges" and "show all inconsistent subgraphs"
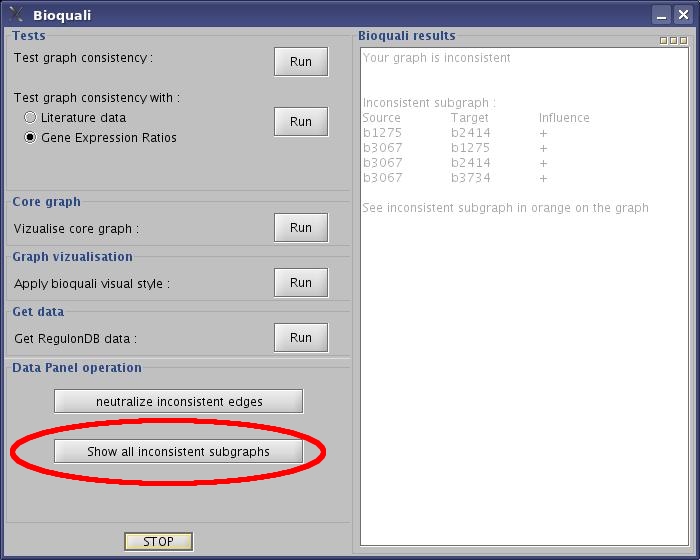
- Click "show all inconsistent subgraphs" button.
 View image
- Wait while bioquali is running...
- Look the result on the cytoscape window :
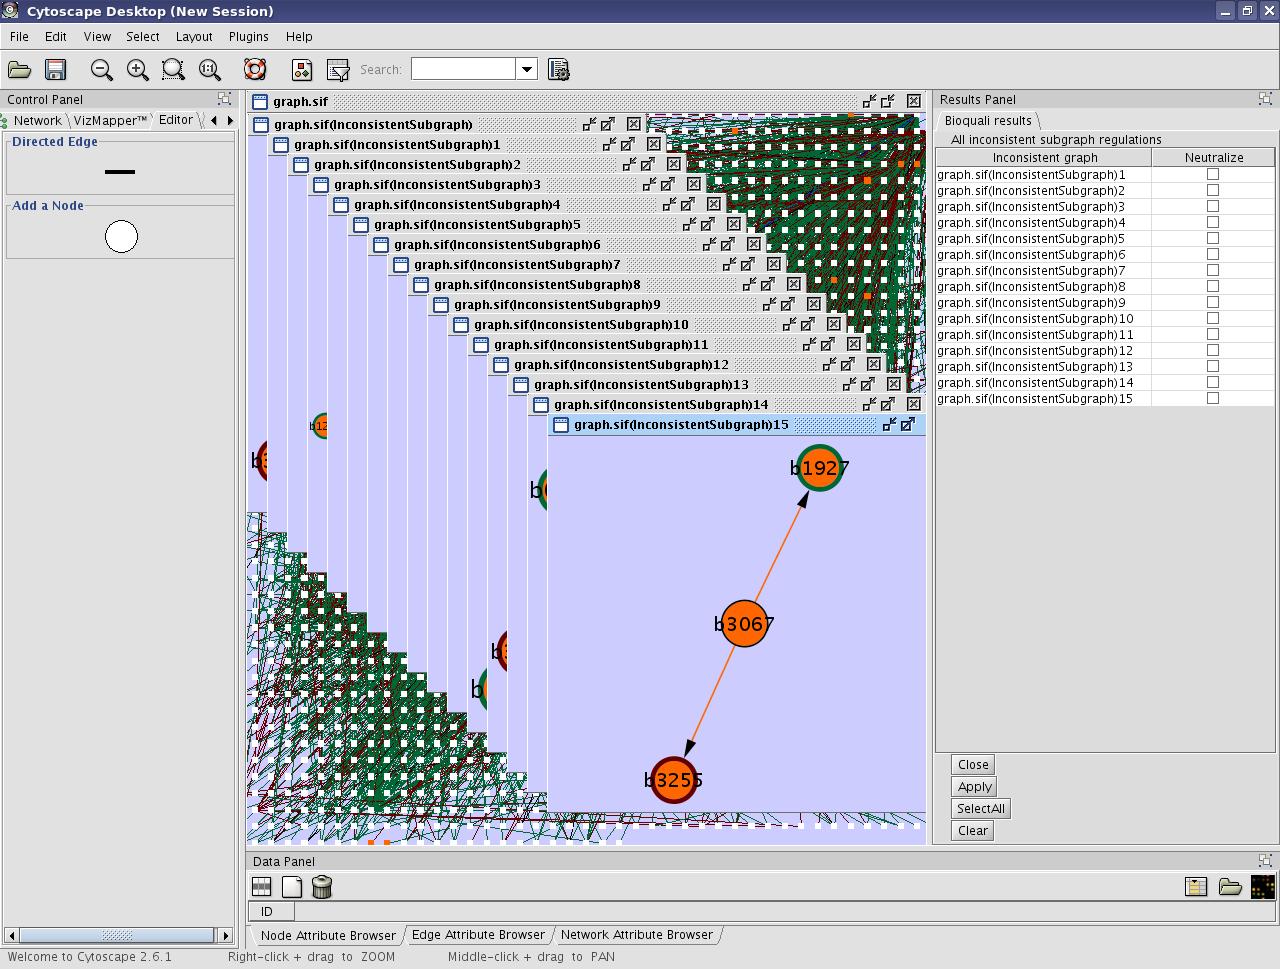 View image
You can see all the inconsistent part of the network in orange on the original graph and new graphs will be built from this inconsistent regions. In our example, we have 16 new sugraphs. The Results Panel in the right will list the inconsistent regulations. You can choose to neutralize some or all inconsistent graphs.